
Bringing a scientific paper to life: An REU’s experience at the NSF Ice Core Facility
Joanny Jimenez, City College of New York undergraduate, and COLDEX 2024 and 2025 REU student
This blog post is by Joanny Jimenez, an undergraduate student at The City College of New York and a COLDEX REU participant. Joanny’s 2025 REU project focused on science communication. Her goal was to take a published scientific paper and turn it into a narrative that can educate and entertain a broad audience.
AND I DIDN’T KNOW ANYTHING TO BEGIN WITH…
Have you ever read something that fascinated you to the point where you find yourself going down some sort of new ‘rabbit hole’ learning all these new things and you just want to know how it works? Well, let me take you on a small adventure of my experience reading a paper on “Three-dimensional multitrack electrical conductivity method for interpretation of complex ice core stratigraphy” by NSF COLDEX graduate student Liam Kirkpatrick and then actually going to see it in person!
My name is Joanny Jimenez and I’m currently an undergraduate at CUNY’s The City College of New York. I’m majoring in earth and atmospheric sciences, on top of double minoring in both anthropology and international studies. Before I was introduced to NSF COLDEX by my advisor/mentor Dr. Neal Phillip, the chairman of the Department of Chemistry, Earth Sciences, & Environmental Sciences at Bronx Community College, I was completely unaware of how measuring ice cores can help us understand past climate records. Why is this an important aspect you might ask? Investigating past climates helps us better predict future climates and understand why and how climate dynamics have changed since the past. This past summer was my second year with the NSF COLDEX Research Experience for Undergraduates (REU) program. During my first year, I collaborated with the Director for Education to analyze demographics and motivations of REU applicants in order to improve outreach in the REU program. This year, I collaborated with the Managing Director exploring the use of narrative as a tool for science communication, incorporating storytelling into ice core science.
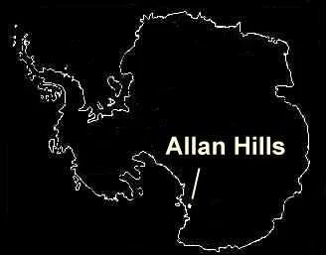
I’m a big fan of non-destructive instruments used within any field, especially in scientific research. The point of it all is to not destroy what has been or is being discovered, enhancing measurements without causing damage to the object. The object in question is ice cores, leading me to ask, what is ice core science? What exactly is being measured and collected from countries around the world in polar places? How exactly does the international ice core science community collaborate with one another? We’ll take a leap together into this ‘rabbit hole’ diving into understanding the different types of measurements but specifically focus on the ins and outs of the multitrack 3D ECM instrument. This is a new method for helping NSF COLDEX understand the complex stratigraphy of the Allan Hills.
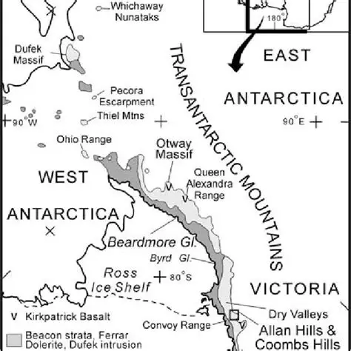
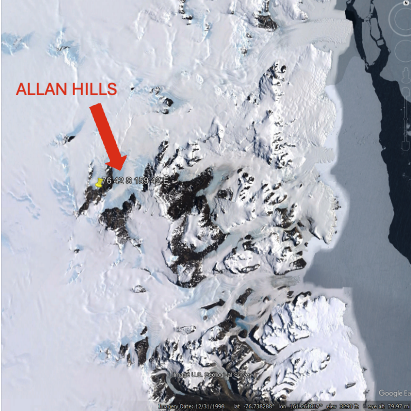
The Allan Hills region of Antarctica is a blue ice area that has the oldest ice ever found on earth - 6 million years old! Members of the US National Science Foundation Center for Oldest Ice Exploration (NSF COLDEX) are drilling for ice there because we can analyze air bubbles trapped within the ice to better understand the climate in Earth’s distant past.
Did you know most deep ice cores that are collected date back to a maximum of 800,000 to 1.2 million years old? Typically, the length of deep ice cores is approximately 2,800 meters (9,186 feet) long. Last year, an international team of 16 scientists from Beyond EPICA-Oldest Ice Project collected the longest continuous (unbroken/uninterrupted) ice core to date! But COLDEX is taking a somewhat different approach to finding and obtaining ancient ice at Allan Hills.
Ice coring has been around since the 1950s, notably drilling in Antarctica and Greenland. Snow falls are slowly converted to ice over many years, and air bubbles formed during that process preserve samples of the world’s ancient atmosphere. These air bubbles inside ice cores are vital for us to understand the history of the Earth’s climate and its atmospheric composition of previous periods in time. The layers of snow accumulation in polar regions also help provide significant time resolution. When snow sticks to the surface, it starts accumulating on top of previous snowflakes that flew before it did. Think about a collection you have, it can be anything. Whatever you buy to add to your collection will always be ‘younger’ than the original piece. It’s similar with the ground beneath you: it’s called stratigraphy, and its layers range the same way with the bottom being older than the top layer you’re on right now.
The ice sheet in Antarctica is always moving slowly, typically flowing downward and eventually out toward the ocean. In the Allan Hills, the ice flows in a direction towards the mountains and gets trapped while pushing onto the mountains. This makes the ancient ice from the bottom fold up toward the surface. To better visualize this, take a second to find a piece of paper (preferably not stiff cardboard). Next, I’d like for you to hold the longer end of the paper in one hand, using the other hand as a flat surface with fingers together and it seems you’re about to give a super stiff high five. Now, with both hands in front of you, start to push the paper onto the flat surface of your palm horizontally.

A hands-on demonstration to help you visualize ice flow in the Allan Hills
As the edge of the paper jams against your hand, the sheet is going to be curved like the image above, giving you an example of what’s occurring to the ice underneath the surface next to the mountains in that region. This ice flow means that very old ice is being pushed close to the surface. Also, the strong winds coming down from the mountains, called katabatic winds, scour away more recent snow accumulation. These winds go downslope from higher elevations carrying high-density air with them and form when mountain surfaces become colder than the air surrounding it. So just imagine, with these two factors combined it means that very old ice is super close to the surface in this area which makes it easier to recover ancient samples with shallow ice cores of only about 100-200 meters long, but it is harder to endure the severe weather conditions.
The same history that allows the ancient ice of Allan Hills to be preserved also results in a complex stratigraphy, causing the ice to dip in unpredictable ways. Instead of having an ice flow that smoothly stretches out for long distances, it seems to be folding up against the edge of the space in an upstream direction making the layers curved. In typical ice cores, the layers are relatively easy to interpret – with the oldest ice at the bottom and the youngest ice at the top. But when the ice folds, the layers in an ice core may be out of order or angled differently, making it difficult to know the age and the order. Remember the collection I told you to think about earlier? Imagine you had it organized in a way you can tell which one you bought first, all the way to the most recent purchase. You don’t have them labeled and dated because you can see from the way it’s stacked which ones are newest. One day, you come home and see that everything is mixed up and out of order from where you left it. You might recognize the first purchase you started the collection with and the most recent one too, but what about all the ones in between? Now it’s time to spend hours researching and looking for clues like receipts or dates within your collection to get it back in order. That kind of detective work is precisely what scientists are doing with a new method on the mixed-up ice cores from the Antarctic region of Allan Hills.
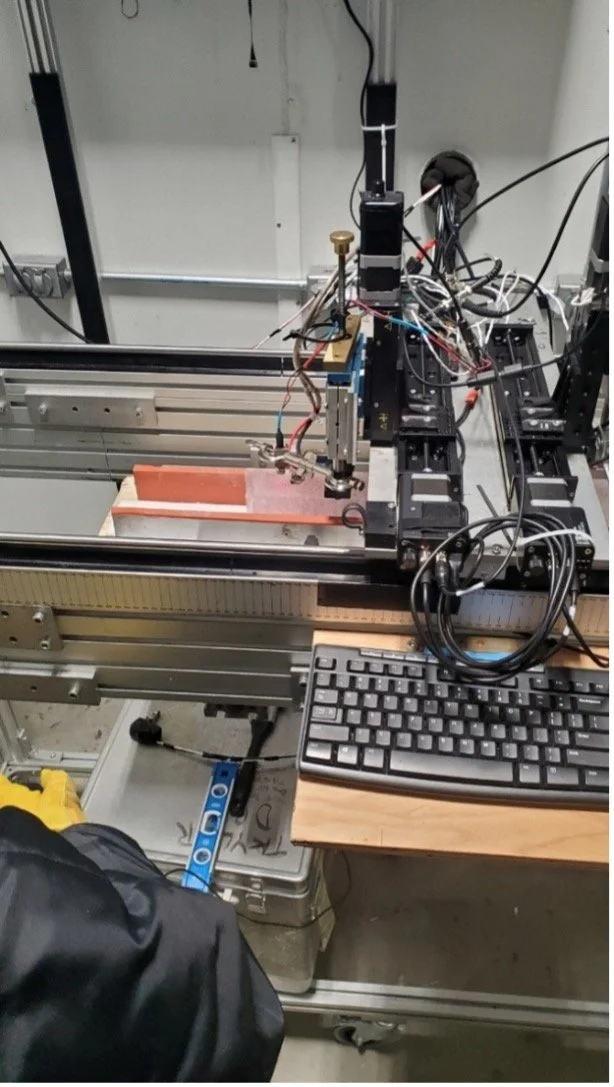
NSF COLDEX graduate student Liam Kirkpatrick from the University of Washington, along with fellow collaborators, has developed the 3D Multitrack Electrical Conductivity Method (ECM) to help identify the ice flow changes that occur in the layers and understand the general structure of the ice cores. This was the very first project he worked on as a PhD student and he was really excited about it. Liam believes this 3D ECM work will not only help NSF COLDEX develop new methods to deal with ice from the Allan Hills, it can help create a small but significant step towards better understanding of glaciology in the region. This technology can also be transferred to the broader ice core community. 3D ECM might seem to be a few steps removed from impacting the general public, but scientists using this method can improve climate reconstruction and overall improve our climate modeling to better comprehend the climate dynamics over long time scales.
When I read the paper and found out the Electrical Conductivity Method instrument (ECM) is a non-destructive instrument, I was fascinated by how it’s able to work electrodes onto ice. Now, usually my first thought is that electricity and water are not something you should be putting together. However, this is not anything close to it being so dangerous. Seriously though, a random image popped up in my mind of someone just willy-nilly putting electrical cables into a bucket of water, but that’s not the case at all! While reading the paper, it was hard for me to visualize the machinery and the setup, but fortunately I was able to see it in person later. But before we get to the experience of actually working with ECM, let’s learn more about the research and Liam’s experiences developing it.
The history of the Electrical Conductivity Method (ECM) goes back to early Greenland scientific field work. It’s a well-established measurement that is often standard practice in ice core processing. Electrical conductivity methods have gained momentum in ice core science as a tool to help understand the structure of layering. ECM uses two types of measurements on ice cores, an alternating current (AC) and direct current (DC). Both types of electrical conductivity play a crucial role but behave quite differently from one another. DC conductivity flows in a straight line with unchanging direction while AC conductivity alternates back and forth in the pattern of a wave that oscillates. In that case, the use of both conductivities through the 3D multitrack ECM on an ice core can provide an additional dimension with all new sets of information. ECM’s original use was tasked in identifying acidity peaks from past volcanic eruptions as well as identifying stratigraphy in 2D.
However, the original ECM instrument was capturing measurements in a two-dimensional plane, which can be insufficient for understanding a three-dimensional object. Given the complex folding that happens in the Allan Hills cores, 2D measurements alone couldn’t get a full visual of the patterns in these ice cores. The suggestion to try this method in three-dimensions instead of two came from T.J. Fudge, Liam’s advisor and mentor. T.J. worked on ECM during his own PhD years and was specifically focused on the WAIS (West Antarctic Ice Sheet) Divide. He used the ECM instrument in two dimensions to examine ice core layer orientation and structure to map the layers of ice. Liam started on this path by reading those papers from T.J.’s work, and T.J.’s suggestion helped kick-start this research project and eventual publication on 3D multitrack ECM work.
As interesting as the paper was, I was left with so many questions. How was I going to write about this important scientific research on using an instrument I’ve never seen before and am having a hard time visualizing its function? How cold is -24 degrees Celsius? How far away are the ice cores stored from the machinery? Are there dollies to roll over the ice cores and/or instruments? How big is this facility anyway? With all these random questions circulating my mind, I thought it wouldn’t hurt to ask about helping in the Ice Core Facility and potentially shadowing Liam taking measurements with the ECM instrument. The worst that can be said is no, right? Someone once told me, “You miss 100% of the opportunities you don’t take.” How will you know if you don’t try?
To my surprise, the answer was yes! I had the privilege to go to the NSF Ice Core Facility (NSF ICF) to help out in the Core Processing Line (CPL) for one week in July 2025. This then allowed me to see and use the ECM instrument in person, helping me to better understand its mechanics.
BUT, I WAS GIVEN THE OPPORTUNITY OF A LIFETIME TO GO TO THE NSF ICE CORE FACILITY AND SEE THE INSTRUMENT LIVE IN PERSON…..
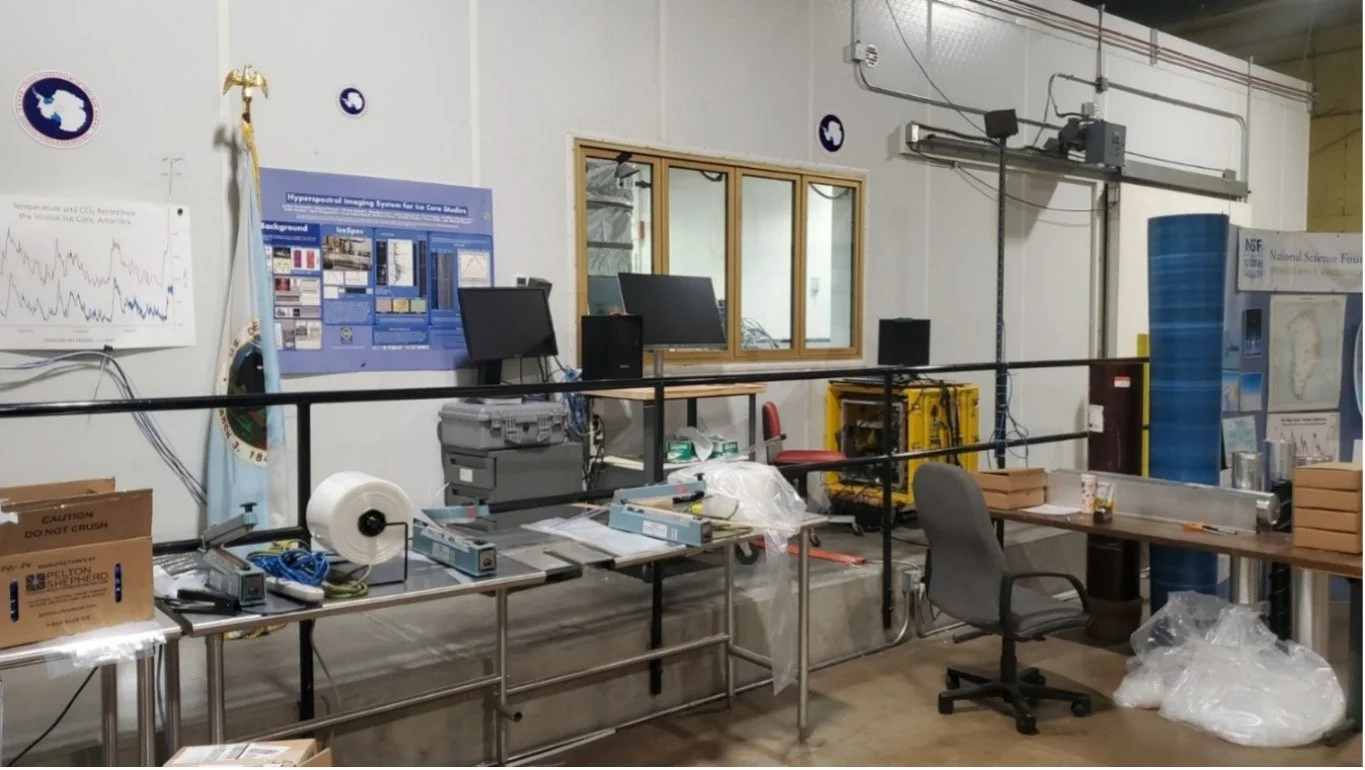
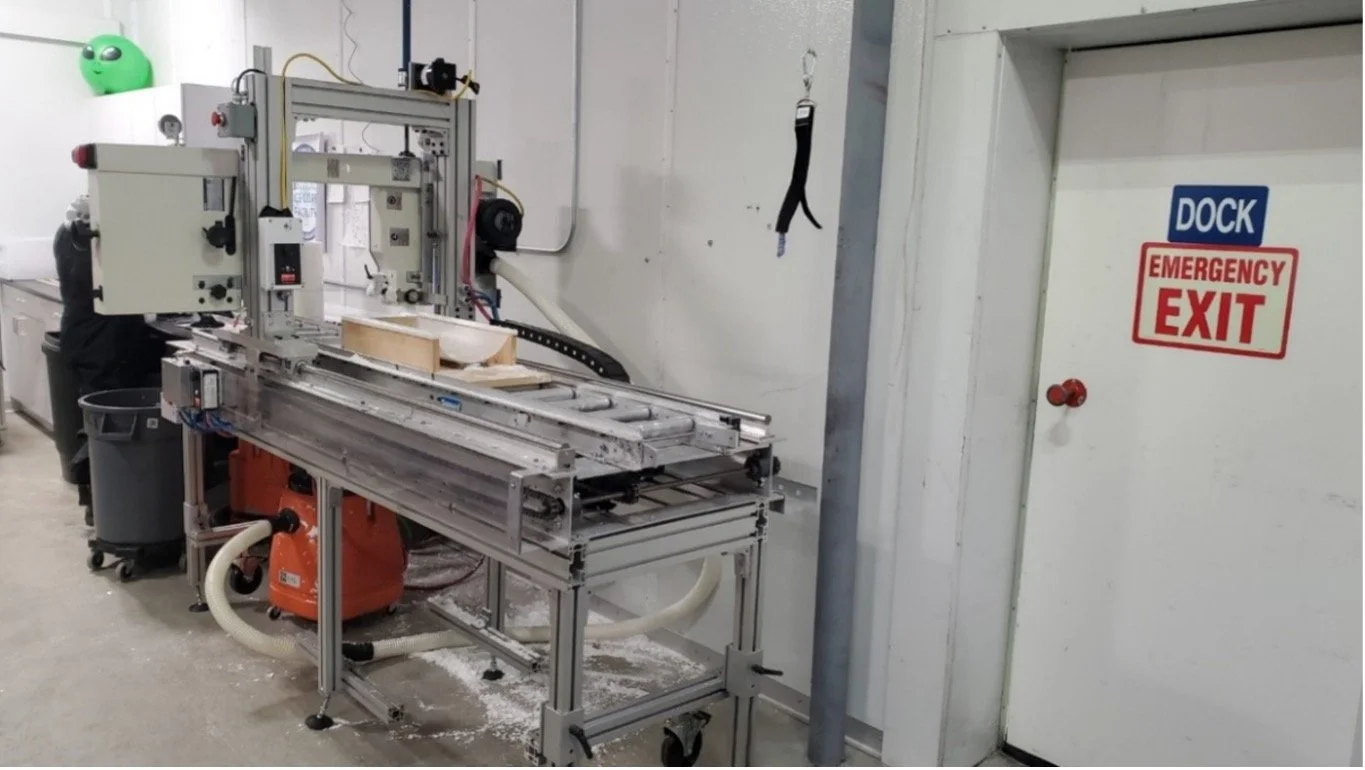
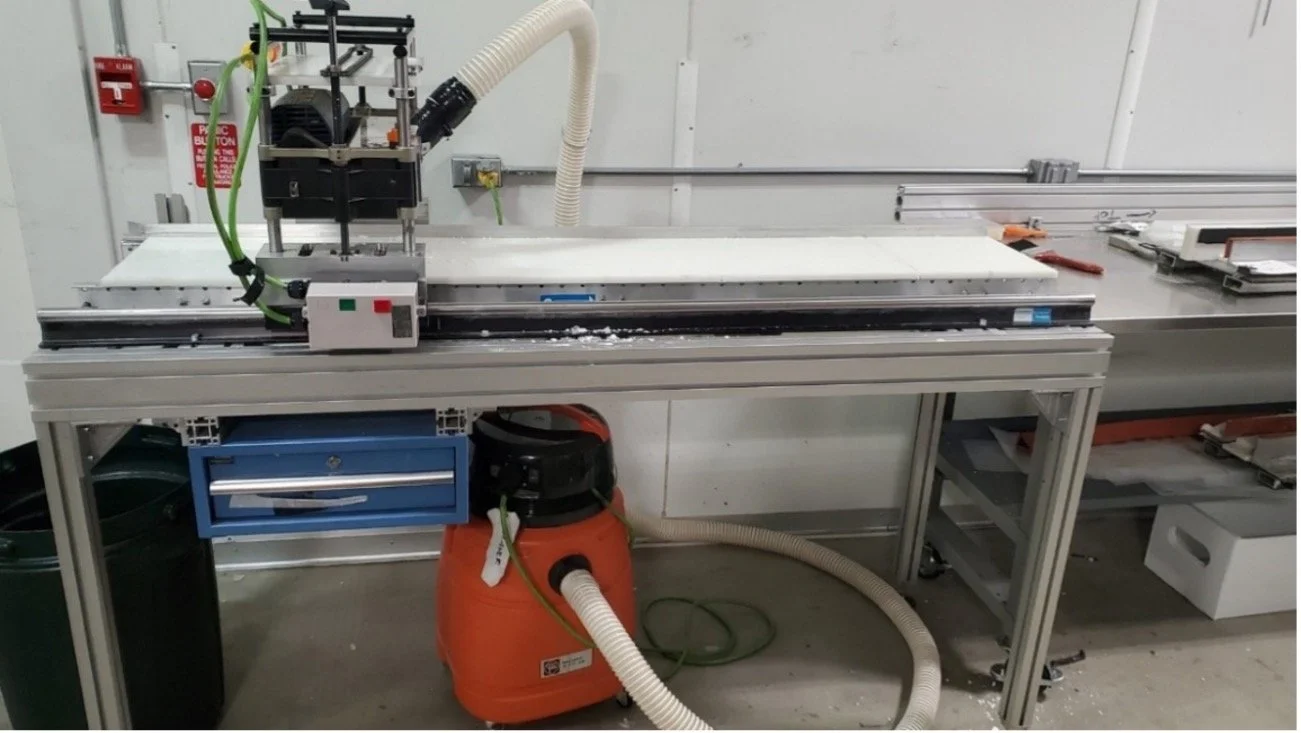
Ever seen or been in a huge place thinking to yourself, “does this ever end?!” That was my first impression of the Denver NSF Ice Core Facility. This place was as big as Dracula’s castle in Transylvania, not the design but the space in this warehouse was out of this world. Now remember all those questions I initially had about ice cores and domestic/international collaboration? The answers came flooding in, and by the time the week was up, I had a better understanding of my overall surroundings during the Core Processing Line, or CPL. During the CPL, NSF COLDEX team members come to the ICF to physically take measurements, cut up samples, bottle them up and help ship them to laboratories around the United States.
I learned that measurements range from water isotopes, to figuring out the different sizes of air bubbles, to measuring ice cores with electrodes to create 2D and now 3D map layouts of the complex ice stratigraphy to visualize the layers. All the experiments and measurements take place in the exam room, which is between the warm room and storage freezer.
Let’s take a mental walk through the important areas I was working in during my time there. First, there’s a common area outside these three rooms where you can leave your stuff, have food and relax. The warm room is a 2-step staircase away from the common area. It’s exactly what it’s called, a room to help you warm up from the cold temperatures of the freezers. Next, you open up a heavy door to step into the exam room. This is a -24°C area where all the magic happens (and when I say magic, I mean scientific experiments and measurements). Lastly, the third room is the storage freezer that is approximately -36°C and it holds all the ice cores, many of which are hundreds of thousands to millions of years old! Silver long tubes on all the shelves reach towards the ceiling, an absolutely stunning sight to see.
Important work also happens outside the freezer, like labeling sample bottles. It may not sound like much, but labeling is an IMPORTANT aspect to organizing and maintaining samples of any kind to know what it is you’re looking at. Indulge me for a second, let’s say you’re with a group of people and everyone is given the same drink, and nobody puts their names on it. Same color bottle, same liquid, same everything right? If everyone decides to place their drinks on the SAME table next to the SAME exact looking drinks, which one is yours? You know what would help in this situation – a label with your name on the bottle. The whole point is, it’s important to know what exactly you’re looking at. Another job was to heat seal ice packs into plastic layflat which help prevent leakage in case an ice pack were to break open. These ice packs are then stored in the freezer and used for the shipments of the samples. I had the opportunity to do tasks both outside and inside the freezer. Both areas are unique and important to the efficient functioning of the CPL.
This brings me to the 3D multitrack ECM instrument I examined and used while shadowing Liam and Emma Erwin. Emma is a graduate student at the University of Maine who came to learn how to use the equipment. I’ll take you down my own virtual reality of non-AI photos I personally took during my time at the ICF. The following images will immerse you (hopefully) and will start off right outside the examination freezer.
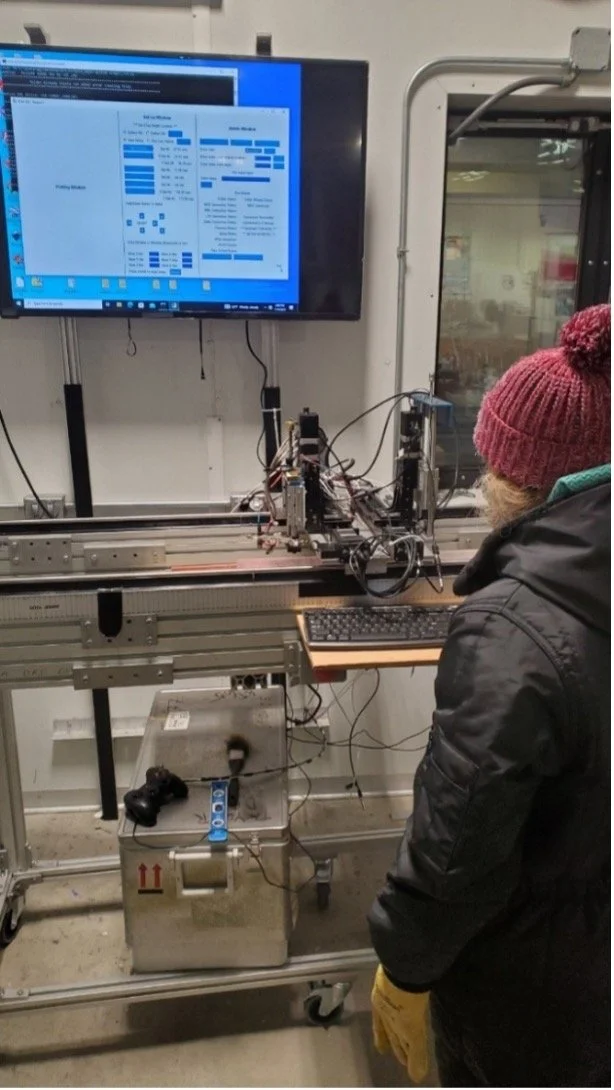
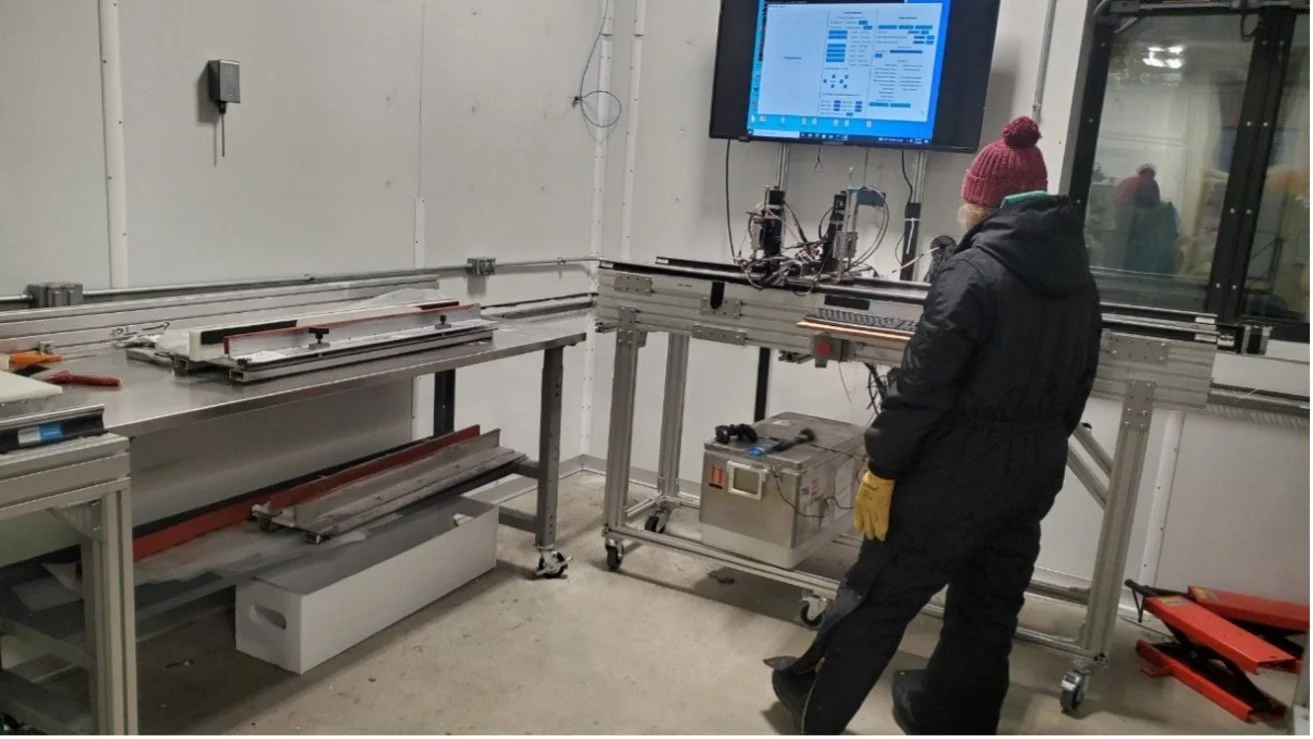
THEREFORE, I WAS ABLE TO UNDERSTAND THE IMPORTANCE AND TECHNICAL WORKINGS OF THE 3D MULTITRACK ECM INSTRUMENT...
I personally want to take this opportunity to thank Liam for letting me shadow his work and answering all my questions during the first week of CPL. I would also like to extend my gratitude to Curt LaBombard and Richard Nunn, the curator and assistant curator of the ICF. These three truly go above and beyond in a field that they are passionate about. Not everyone you meet throughout your life leaves a lasting impression that can change your life for the better, but I can say that about these three brilliant individuals, and about the entire ice core science community. I felt welcomed into a community that is brand new to me with people eager to share their research and personal journeys. I can’t emphasize enough how much people in this field are eager to express their experiences of fascinating hurdles they’ve pulled through and mind-blowing research expeditions!
Collaboration amongst scientists domestically and internationally is a top priority in the science community which helps all fields come together. It was amazing to take part in such an incredible venture with individuals who not only have their own projects but bring them together to form a magnificent collaboration. The behind-the-scenes dedication and passion for using the 3D Multitrack ECM that I was able to witness with my very own eyes from Liam goes to show that this single research project is an important step towards enhancing our understanding in the structured ice layers – like throwing a tiny pebble into a pond creating ripples in previously motionless water.
During the interview with Liam, I was able to understand not only his research and its importance behind it, but also the utter compassion he had behind the work that was being done. So many of his encounters throughout his process were truly fascinating to hear. I asked, “Who and what helped you along the way?” and he expressed excitement to speak about those who helped, but a sign of sadness as the list was too massive to say. In addition to T.J. Fudge and his idea to start down this line of research, Liam is grateful to all of the co-authors on the paper. In particular, Austin Carter, a postdoctoral researcher at Princeton, who took meticulous notes going back years in field seasons. Some of that information was thought to be “unimportant,” but years later Liam discovered it was extremely important to his work.
When collecting ice cores, it’s important to know what side of the ice core is the top. On an ice core, there are orientation lines drawn on the core letting you know which side is right up. If you are holding the ice core vertically, it’ll go down the side of the core, and the overall goal is to have the next piece of ice that comes up try to fit them together like puzzle pieces. If the ice cores do match, you’ll keep drawing the same orientation line. Then finally at the surface we will know where exactly on the core that line is.
Austin took these orientation lines one step further, trying to preserve information about how the core was rotated when it was in the ice sheet. He used GPS measurements to draw out on the ice a little notch to show which direction it was pointing. For about 2 years nobody touched that data as far as Liam knows, but it ended up being a really important component. Because the ice at Allan Hills is folded and complicated, it is helpful when looking at an ice core to know which way is north, so that you can use your knowledge of the glacier’s movement to understand which way the ice in the core is folded. On one of Liam’s last figures in his paper has a map with radar data and an arrow. That arrow is only possible because Austin wrote those notes and did that work in the field.
Curt La Bombard, the curator at the NSF Ice Core Facility, and Richard Nunn, assistant curator, put in countless hours with helping Liam in his research. They helped with so many little but significant things like helping set up the ECM to measure different sizes of ice cores, figuring out measurements, and showing where to measure depth from a core. The CPL and Pre-CPL teams from both last year and this year were also essential to the success of this project. During the summer, ice core sample requests are processed to be shipped out to different laboratories across multi-institutions associated with the NSF COLDEX organization. It’s an all-hands-on deck situation where different tasks are needed within and outside of the freezer. The data collected in 2024 helped out the 2025 team a lot and it’s all thanks to graduate students Fairuz Ishraque from Princeton University and Olivia Williams from Oregon State University. These two were able to unbox all the ice within a week during the pre-CPL. So, all of the measurements wouldn’t have been possible without them doing a bunch of massive lifting and unboxing.
My personal take away from the whole experience is that I didn’t realize how vital ancient ice can truly be to our understanding of present and future climates. Every single person that is involved in this multi-institution collaboration has dedicated their lives to this work. Liam’s research is only one of many amazing projects happening and it was an honor to read his paper on Multitrack 3D ECM before it was officially published. He expressed the importance this work has to the NSF COLDEX mission by helping to push the boundary in the funky area of the Allan Hills. In his words, “I think this is a small but significant step towards figuring out how to work with this better and understanding the region.” Liam also said, “I think having this method out there in the ice core community is going to be really helpful. I actually already have projects going outside of COLDEX that kind of build on some of this work. I do think there’s some transfer of the technology to the broader ice core community. But in terms of the general public, I think it’s a few steps removed from impact. However, I do think improving our climate reconstructions with this method improves our climate modeling, improves our understanding of climate change over long-time scales. It’s all small steps but we need to make them to kind of get the most out of the COLDEX project.”